


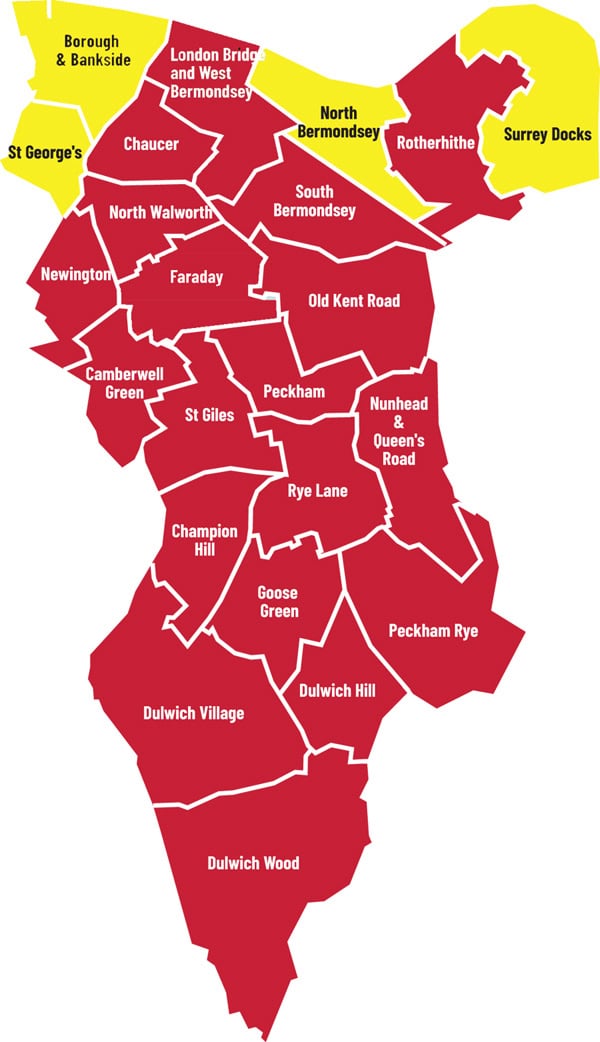
With the votes counted, and the curtain drawns on Southwark’s 2022 local election, here are the results, by ward, in full.
It proved a confident showing from Labour, who gained three new councillors after victroy over the Liberal Democrats in London Bridge and West Bermondsey, taking them from 49 to 52 councillors across the borough.
While the Liberal Democrats performed well nationally, they failed to capitalise in Southwark, a borough where party leader Ed Davey had said they would be “fighting labour”.
The Conservatives had hoped to exploit anger surrounding the low traffic neighbourhood in Dulwich Village and reclaim the ward they had held for decades but ultimatley, Labour prevailed by a convincing margin.
The Greens were not able to add their own representative to Southwark’s two party state and no independent candidates, or those from smaller parties, were elected either.
Those unsure what ward they are in can find out by entering their postcode on this site: https://www.communitysouthwark.org/find-your-ward
Borough and Bankside
| Liberal Democrats | 1236 votes | 19% | Elected | |
| Liberal Democrats | 1187 votes | 19% | Elected | |
| Liberal Democrats | 1136 votes | 18% | Elected | |
| Labour | 725 votes | 11% | Not elected | |
| Labour | 699 votes | 11% | Not elected | |
| Labour | 698 votes | 11% | Not elected | |
| Conservative | 223 votes | 3% | Not elected | |
| Conservative | 212 votes | 3% | Not elected | |
| Conservative | 195 votes | 3% | Not elected | |
| Trade Unionist and Socialist Coalition | 85 votes | 1% | Not elected |
Camberwell Green
| Labour and Co-operative | 2282 votes | 25% | Elected | |
| Labour and Co-operative | 2281 votes | 25% | Elected | |
| Labour and Co-operative | 2090 votes | 23% | Elected | |
| Green | 798 votes | 9% | Not elected | |
| Liberal Democrats | 353 votes | 4% | Not elected | |
| Liberal Democrats | 350 votes | 4% | Not elected | |
| Conservative | 273 votes | 3% | Not elected | |
| Conservative | 254 votes | 3% | Not elected | |
| Conservative | 219 votes | 2% | Not elected | |
| Liberal Democrats | 200 votes | 2% | Not elected | |
| Trade Unionist and Socialist Coalition | 126 votes | 1% | Not elected |
Relatedarticles


Champion Hill
| Labour | 1629 votes | 34% | Elected | |
| Labour | 1610 votes | 34% | Elected | |
| Green | 535 votes | 11% | Not elected | |
| Liberal Democrats | 311 votes | 7% | Not elected | |
| Liberal Democrats | 293 votes | 6% | Not elected | |
| Conservative | 202 votes | 4% | Not elected | |
| Conservative | 187 votes | 4% | Not elected |
Chaucer
| Labour | 1916 votes | 24% | Elected | |
| Labour | 1761 votes | 22% | Elected | |
| Labour | 1470 votes | 18% | Elected | |
| Green | 637 votes | 8% | Not elected | |
| Liberal Democrats | 609 votes | 7% | Not elected | |
| Liberal Democrats | 539 votes | 7% | Not elected | |
| Liberal Democrats | 403 votes | 5% | Not elected | |
| Conservative | 280 votes | 3% | Not elected | |
| Conservative | 257 votes | 3% | Not elected | |
| Conservative | 251 votes | 3% | Not elected |
Dulwich Hill
| Labour | 1846 votes | 35% | Elected | |
| Labour | 1298 votes | 25% | Elected | |
| Green | 698 votes | 13% | Not elected | |
| Liberal Democrats | 489 votes | 9% | Not elected | |
| Liberal Democrats | 341 votes | 7% | Not elected | |
| Conservative | 289 votes | 6% | Not elected | |
| Conservative | 277 votes | 5% | Not elected |
Dulwich Village
| Labour and Co-operative | 2111 votes | 23% | Elected | |
| Labour and Co-operative | 1922 votes | 21% | Elected | |
| Liberal Democrats | 1133 votes | 12% | Not elected | |
| Conservative | 1063 votes | 12% | Not elected | |
| Conservative | 1053 votes | 12% | Not elected | |
| Liberal Democrats | 1037 votes | 11% | Not elected | |
| Green | 387 votes | 4% | Not elected | |
| Green | 370 votes | 4% | Not elected | |
| Reform UK | 50 votes | 1% | Not elected |
Dulwich Wood
| Labour | 1783 votes | 29% | Elected | |
| Labour | 1621 votes | 26% | Elected | |
| Conservative | 706 votes | 12% | Not elected | |
| Conservative | 675 votes | 11% | Not elected | |
| Green | 449 votes | 7% | Not elected | |
| Green | 303 votes | 5% | Not elected | |
| Liberal Democrats | 300 votes | 5% | Not elected | |
| Liberal Democrats | 299 votes | 5% | Not elected |
Faraday
| Labour | 1475 votes | 22% | Elected | |
| Labour | 1450 votes | 22% | Elected | |
| Labour | 1445 votes | 22% | Elected | |
| Green | 390 votes | 6% | Not elected | |
| Green | 369 votes | 6% | Not elected | |
| Conservative | 250 votes | 4% | Not elected | |
| Conservative | 226 votes | 3% | Not elected | |
| Liberal Democrats | 216 votes | 3% | Not elected | |
| Let London Live | 200 votes | 3% | Not elected | |
| Liberal Democrats | 197 votes | 3% | Not elected | |
| Liberal Democrats | 189 votes | 3% | Not elected | |
| Conservative | 174 votes | 3% | Not elected |
Goose Green
| Labour | 2323 votes | 19% | Elected | |
| Labour | 2108 votes | 17% | Elected | |
| Liberal Democrats | 955 votes | 8% | Not elected | |
| Green | 932 votes | 8% | Not elected | |
| Liberal Democrats | 736 votes | 6% | Not elected | |
| Liberal Democrats | 684 votes | 6% | Not elected | |
| Green | 636 votes | 5% | Not elected | |
| Women’s Equality Party | 414 votes | 3% | Not elected | |
| Conservative | 311 votes | 3% | Not elected | |
| Conservative | 294 votes | 2% | Not elected | |
| Conservative | 275 votes | 2% | Not elected |
London Bridge and West Bermondsey
| Labour | 1716 votes | 17% | Elected | |
| Labour | 1586 votes | 15% | Elected | |
| Labour | 1562 votes | 15% | Elected | |
| Liberal Democrats | 1205 votes | 12% | Not elected | |
| Liberal Democrats | 1193 votes | 12% | Not elected | |
| Liberal Democrats | 1119 votes | 11% | Not elected | |
| Green | 495 votes | 5% | Not elected | |
| Green | 343 votes | 3% | Not elected | |
| Green | 280 votes | 3% | Not elected | |
| Conservative | 262 votes | 3% | Not elected | |
| Conservative | 261 votes | 3% | Not elected | |
| Conservative | 237 votes | 2% | Not elected |
Newington
| Labour | 2051 votes | 22% | Elected | |
| Labour | 2011 votes | 22% | Elected | |
| Labour | 1955 votes | 21% | Elected | |
| Green | 494 votes | 5% | Not elected | |
| Green | 453 votes | 5% | Not elected | |
| Liberal Democrats | 408 votes | 4% | Not elected | |
| Green | 371 votes | 4% | Not elected | |
| Liberal Democrats | 368 votes | 4% | Not elected | |
| Liberal Democrats | 350 votes | 4% | Not elected | |
| Conservative | 311 votes | 3% | Not elected | |
| Conservative | 297 votes | 3% | Not elected | |
| Conservative | 233 votes | 3% | Not elected |
North Bermondsey
| Liberal Democrats | 1909 votes | 18% | Elected | |
| Liberal Democrats | 1732 votes | 16% | Elected | |
| Liberal Democrats | 1724 votes | 16% | Elected | |
| Labour | 1227 votes | 12% | Not elected | |
| Labour | 1194 votes | 11% | Not elected | |
| Labour | 1036 votes | 10% | Not elected | |
| Green | 641 votes | 6% | Not elected | |
| Conservative | 415 votes | 4% | Not elected | |
| Conservative | 370 votes | 4% | Not elected | |
| Conservative | 301 votes | 3% | Not elected |
North Walworth
| Labour | 1906 votes | 21% | Elected | |
| Labour | 1771 votes | 20% | Elected | |
| Labour | 1672 votes | 19% | Elected | |
| Green | 652 votes | 7% | Not elected | |
| Liberal Democrats | 453 votes | 5% | Not elected | |
| Green | 424 votes | 5% | Not elected | |
| Green | 413 votes | 5% | Not elected | |
| Liberal Democrats | 396 votes | 4% | Not elected | |
| Liberal Democrats | 337 votes | 4% | Not elected | |
| Conservative | 324 votes | 4% | Not elected | |
| Conservative | 295 votes | 3% | Not elected | |
| Conservative | 237 votes | 3% | Not elected | |
| Independent | 78 votes | 1% | Not elected |
Nunhead and Queen’s Road
| Labour | 2072 votes | 17% | Elected | |
| Labour | 2040 votes | 16% | Elected | |
| Labour | 2025 votes | 16% | Elected | |
| Green | 1551 votes | 12% | Not elected | |
| Green | 1516 votes | 12% | Not elected | |
| Green | 1270 votes | 10% | Not elected | |
| Liberal Democrats | 1193 votes | 10% | Not elected | |
| Conservative | 216 votes | 2% | Not elected | |
| Conservative | 191 votes | 2% | Not elected | |
| Conservative | 188 votes | 1% | Not elected | |
| Liberal Democrats | 142 votes | 1% | Not elected | |
| Liberal Democrats | 134 votes | 1% | Not elected |
Old Kent Road
| Labour | 2283 votes | 25% | Elected | |
| Labour | 2046 votes | 23% | Elected | |
| Labour | 1959 votes | 22% | Elected | |
| Green | 599 votes | 7% | Not elected | |
| Conservative | 400 votes | 4% | Not elected | |
| Liberal Democrats | 375 votes | 4% | Not elected | |
| Conservative | 351 votes | 4% | Not elected | |
| Liberal Democrats | 350 votes | 4% | Not elected | |
| Liberal Democrats | 314 votes | 3% | Not elected | |
| Conservative | 278 votes | 3% | Not elected | |
| Reform UK | 121 votes | 1% | Not elected |
Peckham
| Labour | 2148 votes | 28% | Elected | |
| Labour | 2080 votes | 27% | Elected | |
| Labour | 1987 votes | 26% | Elected | |
| Liberal Democrats | 290 votes | 4% | Not elected | |
| Conservative | 269 votes | 4% | Not elected | |
| Conservative | 259 votes | 3% | Not elected | |
| Liberal Democrats | 232 votes | 3% | Not elected | |
| Liberal Democrats | 208 votes | 3% | Not elected | |
| Conservative | 198 votes | 3% | Not elected |
Peckham Rye
| Labour | 1802 votes | 32% | Elected | |
| Labour | 1751 votes | 31% | Elected | |
| Green | 650 votes | 12% | Not elected | |
| Green | 581 votes | 10% | Not elected | |
| Conservative | 247 votes | 4% | Not elected | |
| Conservative | 213 votes | 4% | Not elected | |
| Liberal Democrats | 185 votes | 3% | Not elected | |
| Liberal Democrats | 181 votes | 3% | Not elected |
Rotherhithe
| Labour and Co-operative | 1782 votes | 18% | Elected | |
| Labour and Co-operative | 1653 votes | 17% | Elected | |
| Labour and Co-operative | 1558 votes | 16% | Elected | |
| Liberal Democrats | 788 votes | 8% | Not elected | |
| Liberal Democrats | 695 votes | 7% | Not elected | |
| Liberal Democrats | 600 votes | 6% | Not elected | |
| Green | 498 votes | 5% | Not elected | |
| Green | 485 votes | 5% | Not elected | |
| Green | 421 votes | 4% | Not elected | |
| Conservative | 381 votes | 4% | Not elected | |
| Conservative | 322 votes | 3% | Not elected | |
| Conservative | 318 votes | 3% | Not elected | |
| Trade Unionist and Socialist Coalition | 102 votes | 1% | Not elected | |
| Social Democratic Party | 57 votes | 1% | Not elected |
Rye Lane
| Labour | 2343 votes | 24% | Elected | |
| Labour | 2123 votes | 21% | Elected | |
| Labour | 2008 votes | 20% | Elected | |
| Green | 943 votes | 10% | Not elected | |
| Green | 653 votes | 7% | Not elected | |
| Liberal Democrats | 451 votes | 5% | Not elected | |
| Conservative | 268 votes | 3% | Not elected | |
| Conservative | 259 votes | 3% | Not elected | |
| Conservative | 243 votes | 2% | Not elected | |
| Liberal Democrats | 243 votes | 2% | Not elected | |
| Liberal Democrats | 238 votes | 2% | Not elected | |
| Trade Unionist and Socialist Coalition | 114 votes | 1% | Not elected |
South Bermondsey
| Labour | 2025 votes | 19% | Elected | |
| Labour | 1900 votes | 18% | Elected | |
| Labour | 1759 votes | 16% | Elected | |
| Liberal Democrats | 1407 votes | 13% | Not elected | |
| Liberal Democrats | 1295 votes | 12% | Not elected | |
| Liberal Democrats | 1277 votes | 12% | Not elected | |
| Conservative | 367 votes | 3% | Not elected | |
| Conservative | 359 votes | 3% | Not elected | |
| Conservative | 328 votes | 3% | Not elected |
St George’s
| Liberal Democrats | 1034 votes | 25% | Elected | |
| Liberal Democrats | 929 votes | 23% | Elected | |
| Labour | 836 votes | 20% | Not elected | |
| Labour | 821 votes | 20% | Not elected | |
| Green | 227 votes | 6% | Not elected | |
| Conservative | 140 votes | 3% | Not elected | |
| Conservative | 114 votes | 3% | Not elected |
St Giles
| Labour | 2606 votes | 24% | Elected | |
| Labour | 2360 votes | 22% | Elected | |
| Labour | 2217 votes | 20% | Elected | |
| Green | 1186 votes | 11% | Not elected | |
| Green | 712 votes | 7% | Not elected | |
| Liberal Democrats | 408 votes | 4% | Not elected | |
| Liberal Democrats | 316 votes | 3% | Not elected | |
| Conservative | 306 votes | 3% | Not elected | |
| Liberal Democrats | 300 votes | 3% | Not elected | |
| Conservative | 270 votes | 2% | Not elected | |
| Conservative | 230 votes | 2% | Not elected |
Surrey Docks
| Liberal Democrats | 1475 votes | 16% | Elected | |
| Liberal Democrats | 1329 votes | 15% | Elected | |
| Liberal Democrats | 1298 votes | 14% | Elected | |
| Labour | 1095 votes | 12% | Not elected | |
| Labour | 1056 votes | 12% | Not elected | |
| Labour | 920 votes | 10% | Not elected | |
| Green | 825 votes | 9% | Not elected | |
| Conservative | 399 votes | 4% | Not elected | |
| Conservative | 371 votes | 4% | Not elected | |
| Conservative | 346 votes | 4% | Not elected |
Southwark elections 2022: Labour tightens its grip on the council with convincing win


