


Figures from the Metropolitan Police in February this year show Southwark was the South East London borough with the highest number of recorded offences of any kind, a fact that has repeated since at least 2011, writes Pablo Munoz…
South East London, which includes Bromley, Bexley, Greenwich, Lewisham and Southwark, saw an fall of nearly one per cent in reported crime in February when compared to the previous month, with a total of 10,512 offences logged, 105 fewer than in January.
February’s overall crime data in Southwark shows a slight downward trend from the previous months of January and December, but historical data shows that the colder months tend to show a lower number of crimes reported in the borough.
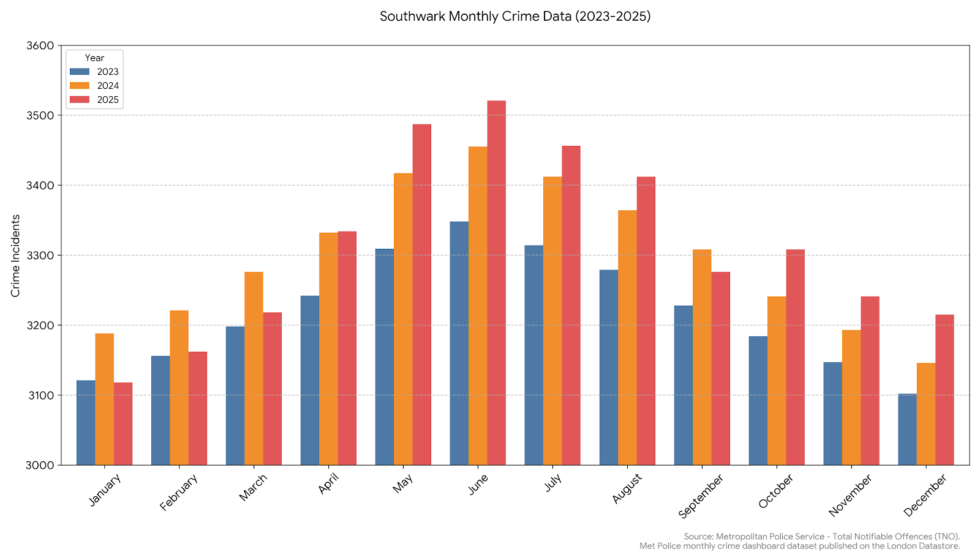
Data Source: Metropolitan Police Service (MPS). Contains public sector information licensed under the Open Government Licence v3.0.
The most common offences in Southwark are theft (1,241) and violence against the person (703), with 176 robberies, 173 vehicle offences, 166 burglaries, 148 arsons and criminal damage. Altogether, theft and violence accounted for more than half of offences.
The second highest number of offences occurred in the borough of Lewisham, with 2,292 offences recorded, with violence against the person (776) and theft (633) being the most common.
Greenwich comes third (2,174), which saw a decrease in crime by one per cent compared to January, followed by Bromley (1,829), London’s largest borough by area. Bexley recorded the lowest number of offences (1,170).
There is a correlation between population density and crime volume, with Southwark and Lewisham being the most densely populated boroughs, which also report the highest offence totals.
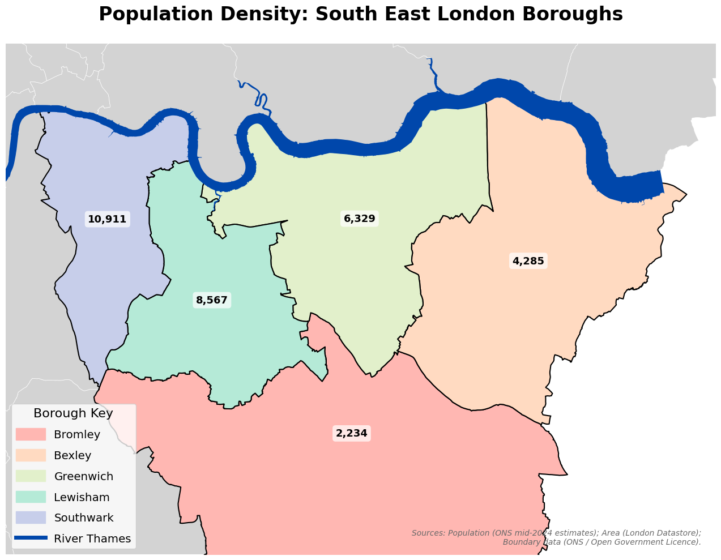
Infographic: Pablo Munoz. Data Source: ONS Mid-2024 Population Estimates & London Datastore Area Data. Contains OS data © Crown copyright and database right 2026
Relatedarticles


Bromley, despite holding the largest population out of the five boroughs (~335,000), had a comparatively low median crime per capita in 2025 of 5.65 offences per 1,000 people, compared to Southwark’s whopping 10.45 offences per 1,000 people. Southwark’s crime per capita was also higher than Lewisham’s 8.05 and Greenwich’s 7.5.
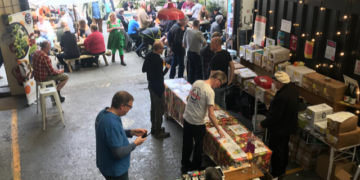
Southwark contains major high-footfall areas, such as London Bridge, Borough Market, South Bank, and Elephant & Castle, which could affect the high numbers, but wealth inequality may also be a factor that impacts the high number of offences.
Poverty rates remain highest in Lewisham (29 per cent) and Greenwich (26 per cent), with Southwark falling third (21 per cent), as per Trust for London Borough Profiles data for 2025/2026, but Southwark has a significantly higher number of social housing (around 38 per cent) than Lewisham (~26 per cent) and Greenwich (~28 per cent).
The GLA Housing in London Report 2024/2025 found that in Southwark and Lewisham, residents spend over 41 per cent of their median pay on rent, far exceeding the “affordable” benchmark of 30 per cent.
Homelessness also remains at critical levels in the borough, with 1 in 36 people being homeless in Southwark as shown by data from Shelter, an organisation providing support to people experiencing homelessness, in its 2025 report.


